4.01 The order-intake key performance indicator sets 2025 excluding a large one-off order (-[n]%) beside 2024 including it (+[n]%), without saying the bases differ
UK Company C · an AIM-quoted scientific instruments group · Presentation point
In brief
The key performance indicator (KPI) table shows Organic order intake of -[n]% for 2025 and +[n]% for 2024. The 2025 figure excludes [subsidiary]'s [product] expedition order; the 2024 figure, as the 2024 report explains, includes it. On the defined Organic basis the movement is -10% (2024: +[n]%); excluding [product] it is -[n]% (2024: +2%). The table pairs the more favourable figure of each year and does not label either.
The evidence, as filed
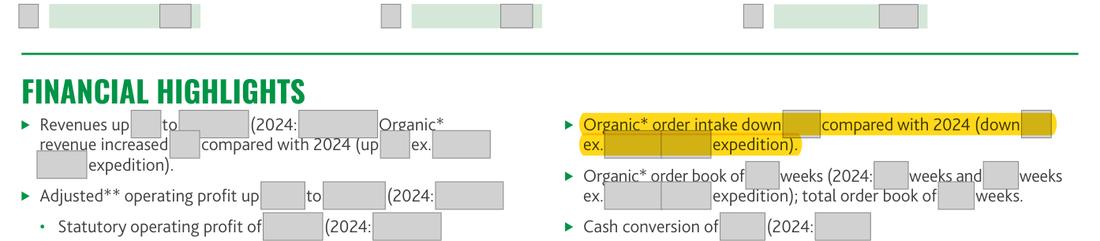
Further pages withheld to protect the company’s identity (four): Annual Report 2025, page 18; Annual Report 2024, page 18; Annual Report 2025, page 19; Annual Report 2025, page 15. Their wording or layout could lead back to the company even with names and figures masked; the evidence list below records what each page shows.
Names, figures, dates, logos and any wording that could be searched back to the company are boxed out in grey; the point is highlighted in yellow.
What the report shows, and what the rule requires
| What the annual report shows | What the rule requires |
|---|---|
| What the annual report shows KPI table: Organic order intake -[n]% (2025) and +[n]% (2024), no basis stated | What the rule requires Both years on one basis and labelled: -10% and +[n]% including a large one-off order, or -[n]% and +2% excluding it (or both lines) |
The rule
Companies Act 2006 s.414C(4)(a)
Version relied on: Companies Act 2006, revised text on legislation.gov.uk as in force for the financial year reviewed
The review must, to the extent necessary for an understanding of the development, performance or position of the company
Why it applies here: the 2025 KPI uses the excluding basis and the 2024 comparative the including basis; a reader comparing the two figures sees neither the like-for-like change (from +2% to -[n]%) nor the change on the defined Organic measure (from +[n]% to -10%).
Why it matters
The comparison in the KPI table understates the deterioration on either consistent basis and does not show the reader that the basis changed between the two columns.
Exposure
No specific requirement fixes the KPI basis; the point goes to a balanced review and could be raised in a Financial Reporting Council (FRC) review of key performance indicators.
Our workings
the KPI table on page 18 lists Organic order intake as one of five KPIs, -[n]% for 2025 and +[n]% for 2024. Page [n] says the 2025 -[n]% is [wording masked] [product] expedition order, and the highlights and the Chief Executive's report say total Organic order intake including that order was down 10%. The 2024 report said 2024 Organic order intake was [n]% above 2023, but only 2% above if a large one-off order is excluded, and its KPI table showed +[n]%.
The narrative explains the 2025 basis, but the table, which the company calls its bellwether for short-term performance, does not.
| Basis | 2025 | 2024 |
|---|---|---|
| Including the [product] expedition order (Organic as defined) | -10% | +[n]% |
| Excluding the [product] expedition order | -[n]% | +2% |
| KPI table as printed | -[n]% (excluding) | +[n]% (including) |
Management’s best defence, and our reply
The company could say the like-for-like basis is the right way to read 2025 because a large one-off order is lumpy and recurs only about three years in four. It could add that page 19 states the 2025 basis plainly, that the highlights give the including-[product] figure, and that the 2024 figure is simply carried from last year's KPI table. However, the 2024 report itself gives the excluding figure of +2%, so a consistent comparative was available, and the table sets two bases side by side under one label. The narrative explains the 2025 number but not the mismatch in the table.
The fix
- Show both years on one basis in the KPI table and label it, for example 'Organic order intake excluding [product]: -[n]% (2024: +2%)', with the including-[product] figures alongside.
Evidence relied on
| # | What it shows | Type | Where |
|---|---|---|---|
| 1 | KPI table: -[n]% for 2025 beside +[n]% for 2024 | Document | Annual Report 2025, page 18 |
| 2 | The 2025 KPI figure excludes a large one-off order | Document | Annual Report 2025, page 19 |
| 3 | On the defined Organic basis 2025 intake fell 10% | Document | Annual Report 2025, page 1 |
| 4 | The 2024 +[n]% includes a large one-off order; excluding it the 2024 figure is +2% | Document | Annual Report 2024, page 18 |
| 5 | The Chief Executive's report gives both 2025 bases: down [n]% excluding the [product] expedition and down 10% including it | Document | Annual Report 2025, page 15 |
Prepared by Pramanex from the company’s published annual reports, without the company’s involvement, to show how an annual report review reads. The company is not named, and nothing on this page is a statement about any identifiable company. Observations are not an audit, review or other assurance engagement, and not legal advice. A regulator-style question is a question, not a conclusion.
Want this on your own annual report, before it is published?
Start with three free findings on your latest published annual report, or talk to us about a fixed-fee pre-publication review.
Your annual report will be in draft before the year-end audit.
Have it read before it is published.
Under NDA, with our reviewer on your insider list under UK MAR.