6.01 The climate targets table reports a rise in location-based Scope 1 and 2 emissions that the company's own emission tables show as a [n]% fall, and several other year-on-year changes do not reproduce
UK Company C · an AIM-quoted scientific instruments group · Compliance or disclosure gap
In brief
Table 7 says absolute Scope 1 and 2 emissions measured on the location-based method rose by [n]% from the 2024 baseline and marks the 2034 and [n] targets as Behind. On the company's own Tables 8 and 9, location-based Scope 1 and 2 emissions fell from [n] to [n] tonnes of carbon dioxide equivalent, a fall of [n]%; only the market-based measure rose (by [n]%). Table 8 also shows total all-scope location-based emissions as up [n]% when the printed figures fall by [n]%, and the narrative says electricity consumption rose [n]% when Table 9 shows it down [n]%.
The evidence, as filed

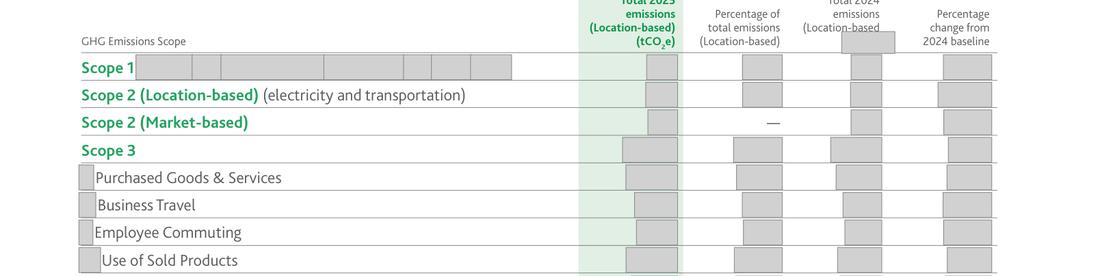
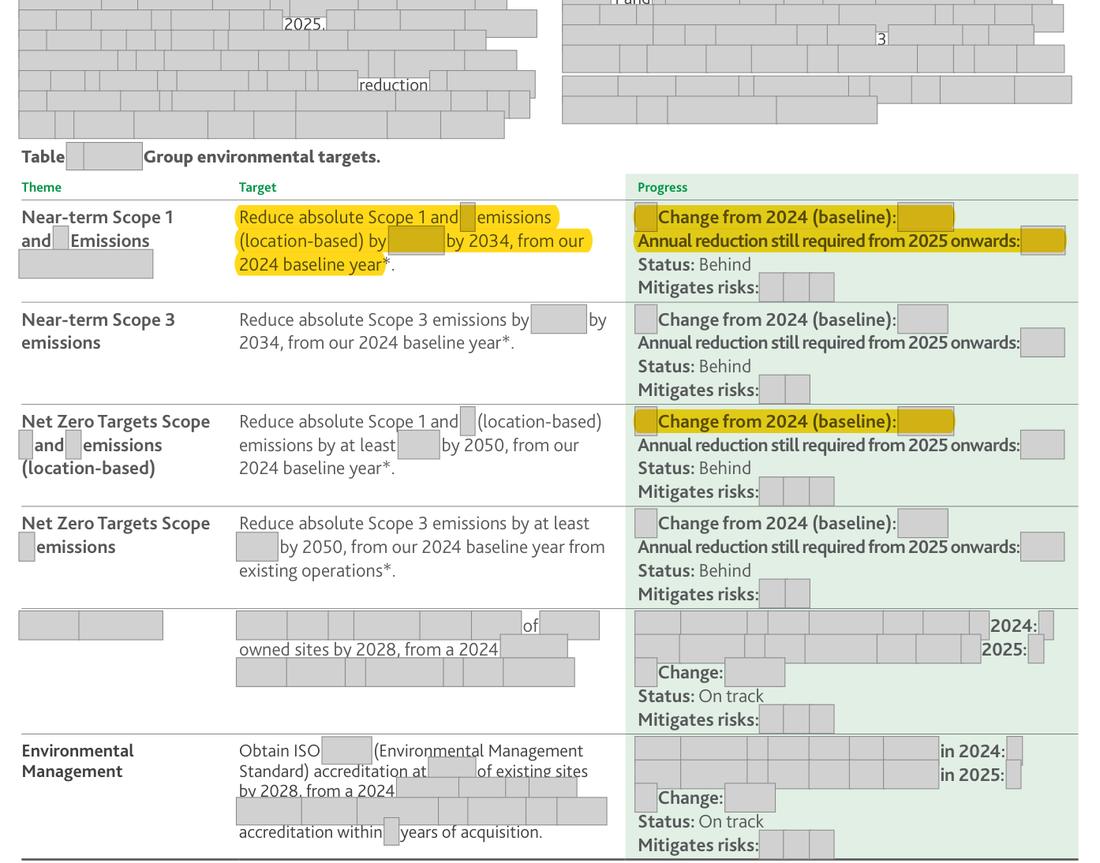
Further pages withheld to protect the company’s identity (two): Annual Report 2025, page 33; Annual Report 2024, page 40. Their wording or layout could lead back to the company even with names and figures masked; the evidence list below records what each page shows.
Names, figures, dates, logos and any wording that could be searched back to the company are boxed out in grey; the point is highlighted in yellow.
What the report shows, and what the rule requires
| What the annual report shows | What the rule requires |
|---|---|
| What the annual report shows Table 7: location-based Scope 1 and 2 change from the 2024 baseline +[n]%, Status: Behind; Table 8: Total All Scopes (Location-based) [n] against [n] shown as +[n]%; narrative: electricity consumption rose [n]% | What the rule requires Performance against each target computed on the basis the target is set (location-based Scope 1 and 2: -[n]% against the 2024 baseline), and every year-on-year change and narrative statement consistent with the figures in Tables 8 to [n] |
The rule
Companies Act 2006 s.414CB(2A)(g)
Version relied on: Companies Act 2006, revised text on legislation.gov.uk as in force for the financial year reviewed
a description of the targets used by the company to manage climate-related risks and to realise climate-related opportunities and of performance against those targets
Companies Act 2006 s.414CB(2A)(h)
Version relied on: Companies Act 2006, revised text on legislation.gov.uk as in force for the financial year reviewed
a description of the key performance indicators used to assess progress against targets used to manage climate-related risks and realise climate-related opportunities and of the calculations on which those key performance indicators are based
Companies Act 2006 s.414CA(1)(e) and (4)(b)
Version relied on: Companies Act 2006, revised text on legislation.gov.uk as in force for the financial year reviewed
a company any securities of which are admitted to trading on the market known as the Alternative Investment Market
Why it applies here: either the Scope 1 and 2 targets are in fact market-based and are mislabelled four times, or the progress figure and status do not belong to the target as described; in either case the required description of performance against the targets disagrees with the company's own emission tables.
Why it matters
- A reader is told that two climate targets are behind and that emissions rose, when on the measure the targets are set the group's Scope 1 and 2 emissions fell by [n]%, ahead of the [n]% average annual reduction the company says the 2034 target needs.
- The statement is the only place the company reports progress against these targets, and executive bonuses are partly linked to climate objectives.
A reader is told that two Board-approved climate targets are behind and that emissions rose, when on the measure the targets are set the Group's Scope 1 and 2 emissions fell by [n]%; the same tables mis-state other year-on-year changes. The statement is the only place the company reports progress against these targets, and executive bonuses are partly linked to climate objectives.
Exposure
No fine attaches to the content of the statement. The realistic consequence is a Financial Reporting Council (FRC) Corporate Reporting Review enquiry and an undertaking to correct the comparatives and the targets table in the next report; the company has already had one such enquiry on the 2024 report.
Our workings
the statement says the company, an AIM company with over [n] employees, is subject to the climate-related financial disclosure requirements. Table 7 sets a near-term target to reduce absolute Scope 1 and 2 emissions (location-based) by [n]% by 2034 and a net zero target on the same location-based measure, and reports progress of +[n]% with status Behind for both. Table 9 gives location-based Scope 1 of [n] (2024: [n]) and Scope 2 of [n] (2024: [n]) tonnes, and market-based Scope 2 of [n] (2024: [n]).
location-based Scope 1 and 2 fell from [n] to [n] tonnes, -[n]%; market-based Scope 1 and 2 rose from [n] to [n] tonnes, +[n]% (the figure the sustainability report on page 31 also gives). The +[n]% is a rise, which only the market-based measure shows; it cannot be the location-based change. On Table 8, total location-based emissions fall from [n] to [n] (-[n]%, printed +[n]%), remaining Scope 3 categories rise from [n] to [n] (+[n]%, printed +[n]%) and total market-based emissions fall from [n] to [n] (-[n]%, printed -[n]%). The narrative on page 39 attributes an increase in Scope 3 emissions to raw materials, natural gas, postage and products sold, while Tables 7 and 8 show total Scope 3 down [n]% (the only Scope 3 rise, +[n]% in Table 9, is the SECR measure limited to sources such as grey-fleet travel, not those drivers); page 40 says electricity consumption rose [n]%, while Table 9 shows Scope 2 consumption down [n]%. Table [n] prints a 2024 market-based intensity of [n] tonnes per full-time equivalent (FTE), but its own +[n]% change and the Table 9 inputs give [n]. The note that comparisons use unrounded figures cannot change the sign of any of these movements.
On the location-based basis the target text describes, the Group is ahead of the average annual reduction of [n]% it says the 2034 target needs.
| Measure | Reported | Recomputed from the company's tables | Working |
|---|---|---|---|
| Scope 1 and 2 location-based, change from 2024 (Table 7) | +[n]% | -[n]% | ([n] + [n]) / ([n] + [n]) - 1 = [n] / [n] - 1 = -[n]% |
| Correct change, one decimal: ([n] - [n]) / [n] x [n] | [n] | -[n] | ([n] - [n]) / [n] x [n] = -[n] |
| Scope 1 and 2 market-based, change from 2024 (for comparison) | not given in Table 7 | +[n]% | ([n] + [n]) / ([n] + [n]) - 1 = [n] / [n] - 1 = +[n]% |
| Difference on the location-based target | +[n]% | -[n]% | [n] - (-[n]) = [n] percentage points |
| Total All Scopes (Location-based), Table 8 | +[n]% | -[n]% | [n] / [n] - 1 = -2% |
| Remaining Scope 3 categories, Table 8 | +[n]% | +[n]% | [n] / [n] - 1 = +[n]% |
| Total All Scopes (Market-based), Table 8 | -[n]% | -[n]% | [n] / [n] - 1 = -1% |
| Scope 2 consumption in kWh (narrative: [n]% increase) | +[n]% | -[n]% | [n] / [n] - 1 = -10% |
| Item | Printed | Recomputed or other place | Working |
|---|---|---|---|
| Total Scope 3 emissions (narrative on page 39: increased; Tables 7 and 8) | increased | -[n]% | [n] / [n] - 1 = -2% |
| 2024 market-based all-scope tonnes per FTE (Table [n]) | [n] | [n] | ([n] + [n] + [n]) / [n] = [n] / [n] = [n] |
| 2025 market-based all-scope tonnes per FTE (Table [n]) | [n] | [n] | ([n] + [n] + [n]) / [n] = [n] / [n] = [n] |
| Year-on-year change in market-based tonnes per FTE | +[n]% | +[n]% only on [n] | [n] / [n] - 1 = +[n]%; [n] / [n] - 1 = +[n]% |
Management’s best defence, and our reply
The company could say the targets were intended to be market-based, so +[n]% is the right progress figure and only the label needs changing, and that the 2025 data were partly extrapolated from ten months, which it discloses. It could add that these are non-financial measures prepared by an external consultant and not audited. However, the target text, the table heading and the narrative all say location-based four times, and Scope 2 location-based reduction is the stated route to the target, so if the targets are market-based the required description of the targets themselves fails instead. Extrapolation changes the inputs, not the arithmetic between the printed figures, and the unrounded-figures note cannot reverse the sign of a [n]% fall.
The fix
- Recompute Table 7 on the basis each target is set (location-based Scope 1 and 2: -[n]%, status ahead of the [n]% average annual reduction), or relabel the targets if they are market-based; correct the Table 8 and Table [n] changes and the 2024 comparatives, and align the narrative on Scope 3 and electricity consumption with the tables.
Where: Table 7 Climate-related targets, page 41: Scope 1 and 2 (location-based) near-term and net zero targets
Proposed wording
% change from 2024: -[n]% Status: Ahead of the [n]% average annual reduction needed
correct Table 8 (total all scopes, location-based, -[n]%; remaining Scope 3 +[n]%; total market-based -[n]%) and the page 40 narrative (Scope 2 consumption down [n]%)
Evidence relied on
| # | What it shows | Type | Where |
|---|---|---|---|
| 1 | The company states that the climate-related financial disclosure requirements apply to it | Document | Annual Report 2025, page 33 |
| 2 | The near-term Scope 1 and 2 target is set on the location-based measure | Document | Annual Report 2025, page 39 |
| 3 | Reported progress against the location-based Scope 1 and 2 targets: a [n]% rise | Document | Annual Report 2025, page 39 |
| 4 | Status Behind follows from the reported rise | Document | Annual Report 2025, page 39 |
| 5 | Narrative says Scope 3 emissions increased | Document | Annual Report 2025, page 39 |
| 6 | Scope 1 tonnes: [n] (2024: [n]) | Document | Annual Report 2025, page 41 |
| 7 | Scope 2 location-based [n] (2024: [n]), market-based [n] (2024: [n]); consumption down [n]% | Document | Annual Report 2025, page 41 |
| 8 | Scope 3 tonnes used in the per-FTE intensity | Document | Annual Report 2025, page 41 |
| 9 | FTE denominators in Table [n] | Document | Annual Report 2025, page 41 |
| 10 | 2024 market-based intensity printed as [n] | Document | Annual Report 2025, page 41 |
| 11 | Scope 3 fell [n]% | Document | Annual Report 2025, page 40 |
| 12 | Remaining Scope 3 change printed +[n]% for a [n]% rise | Document | Annual Report 2025, page 40 |
| 13 | Total location-based change printed +[n]% for a [n]% fall | Document | Annual Report 2025, page 40 |
| 14 | Total market-based change printed -[n]% for a [n]% fall | Document | Annual Report 2025, page 40 |
| 15 | Narrative says electricity consumption increased [n]% | Document | Annual Report 2025, page 40 |
| 16 | Average annual reduction the company says the 2034 target needs | Document | Annual Report 2025, page 39 |
Prepared by Pramanex from the company’s published annual reports, without the company’s involvement, to show how an annual report review reads. The company is not named, and nothing on this page is a statement about any identifiable company. Observations are not an audit, review or other assurance engagement, and not legal advice. A regulator-style question is a question, not a conclusion.
Want this on your own annual report, before it is published?
Start with three free findings on your latest published annual report, or talk to us about a fixed-fee pre-publication review.
Your annual report will be in draft before the year-end audit.
Have it read before it is published.
Under NDA, with our reviewer on your insider list under UK MAR.