2.20 The Chief Executive's 2023 total pay is [amount] in the single-figure table but [amount] in the ten-year and pay ratio tables
UK Company B · a UK-listed technology and logistics group · Regulator-style question
In brief
The audited single total figure table gives the Chief Executive's 2023 remuneration as [amount]. The ten-year history table and the pay ratio table in the same report give 2023 as [amount]. No note says the 2023 figure was revised.
The evidence, as filed
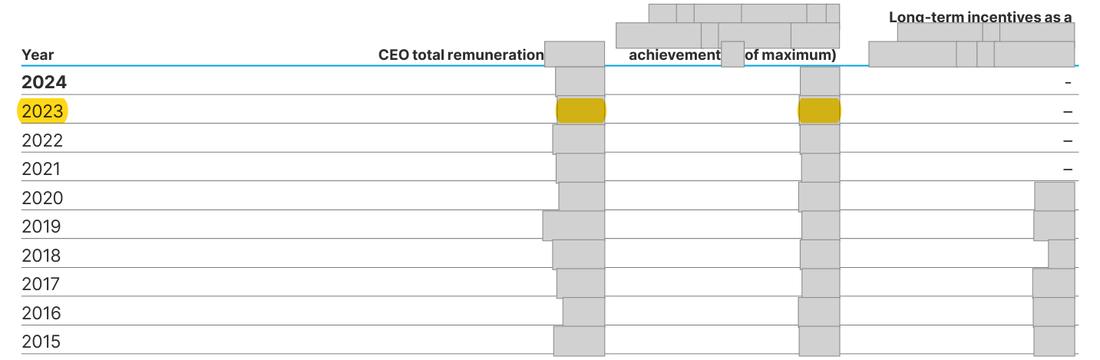
Further pages withheld to protect the company’s identity (three): Annual Report 2024, page 132; Annual Report 2025, page 151; Annual Report 2024, page 139. Their wording or layout could lead back to the company even with names and figures masked; the evidence list below records what each page shows.
Names, figures, dates, logos and any wording that could be searched back to the company are boxed out in grey; the point is highlighted in yellow.
What the report shows, and what the rule requires
| What the annual report shows | What the rule requires |
|---|---|
| What the annual report shows Single total figure table: 2023 total remuneration [amount]. Ten-year table and pay ratio table: 2023 [amount]. No revision note. | What the rule requires One 2023 figure throughout, or a footnote saying the comparative was revised, by how much and why, and which tables keep the figure as first reported. |
The rule
SI 2008/410 Schedule 8, paragraph 18(5)(a) (performance table for previous years)
Version relied on: Large and Medium-sized Companies and Groups (Accounts and Reports) Regulations 2008 (SI 2008/410), in force from April 2008, as amended (the directors’ remuneration report Schedule 8 as substituted from October 2013); revised text, legislation.gov.uk
Sub-paragraph (2) may be complied with by use of either— (a)a sum based on the information supplied in the directors’ remuneration reports for those previous years
Why it applies here: either the 2023 comparative in the single-figure table was revised (for example a share award valued at its actual vesting price) without a note, or one of the tables carries a transcription slip.
Why it matters
A reader cannot tell which 2023 figure is right, and the 2023 pay ratios rest on [amount] while the audited comparative is [amount].
Exposure
A [amount] difference in a comparative; no consequence beyond clarity of the remuneration report.
Our workings
the single total figure table shows the Chief Executive's total remuneration as [amount] for 2024 and [amount] for 2023, made up of total fixed pay of [amount] and total variable pay of [amount]. The ten-year Chief Executive history table and the pay ratio table (p.139, labelled 'reported figures') show [amount] for 2023. The 2025 report repeats [amount] for 2023 in its ten-year table.
[n] + [n] = [n]; [n] - [n] = 7, a difference of [amount].
The report does not say which.
| Item | Figure (£'[n]) |
|---|---|
| 2023 single figure: fixed [n] + variable [n] | [n] + [n] = [n] |
| 2023 in ten-year and pay ratio tables | [n] |
| Difference | [n] - [n] = 7 |
Management’s best defence, and our reply
The company could say that the ten-year table may lawfully use the figures given in earlier remuneration reports, and that the pay ratio table is expressly labelled 'reported figures', so [amount] is the figure published in 2023 while [amount] is the updated comparative (for example after an award was valued at its actual vesting price). That would be a tenable approach. The answer: it is tenable, but the report does not say a comparative was revised, so the reader is left with two figures for the same year; a footnote would settle it.
The fix
- Add a footnote to the single-figure table: 'The 2023 total has been revised from [amount] to [amount] because ...; the ten-year and pay ratio tables show the figure as reported in 2023.'
Question for the company
Which is the Chief Executive's 2023 single total figure, [amounts]? If the 2023 comparative was revised, which element changed, by how much, and why is the revision not footnoted?
Evidence relied on
| # | What it shows | Type | Where |
|---|---|---|---|
| 1 | Single total figure table: Chief Executive 2024 [amount] and 2023 [amount] | Document | Annual Report 2024, page 132 |
| 2 | 2023 fixed pay [amount] | Document | Annual Report 2024, page 132 |
| 3 | 2023 variable pay [amount] | Document | Annual Report 2024, page 132 |
| 4 | Ten-year table: 2023 Chief Executive total remuneration [amount] | Document | Annual Report 2024, page 140 |
| 5 | Pay ratio table: 2023 Chief Executive remuneration [amount] | Document | Annual Report 2024, page 139 |
| 6 | The 2025 report keeps [amount] for 2023 in its ten-year table | Document | Annual Report 2025, page 151 |
Prepared by Pramanex from the company’s published annual reports, without the company’s involvement, to show how an annual report review reads. The company is not named, and nothing on this page is a statement about any identifiable company. Observations are not an audit, review or other assurance engagement, and not legal advice. A regulator-style question is a question, not a conclusion.
Want this on your own annual report, before it is published?
Start with three free findings on your latest published annual report, or talk to us about a fixed-fee pre-publication review.
Your annual report will be in draft before the year-end audit.
Have it read before it is published.
Under NDA, with our reviewer on your insider list under UK MAR.