2.07 The relative importance of spend on pay chart labels wages and salaries as 'Total Employee Costs' and shows attributable profit while the text says trading profit
UK Company A · a UK-listed medical technology group · Presentation point
In brief
The chart headed 'Total Employee Costs' shows [amount] for 2024, which is the wages and salaries line of Note 3.1; total staff costs in the same note are [amount]. The text above the chart says spend on pay is compared with '[wording masked]', but the third bar is attributable profit ([amount]), not trading profit. The 2025 report repeats both features.
The evidence, as filed
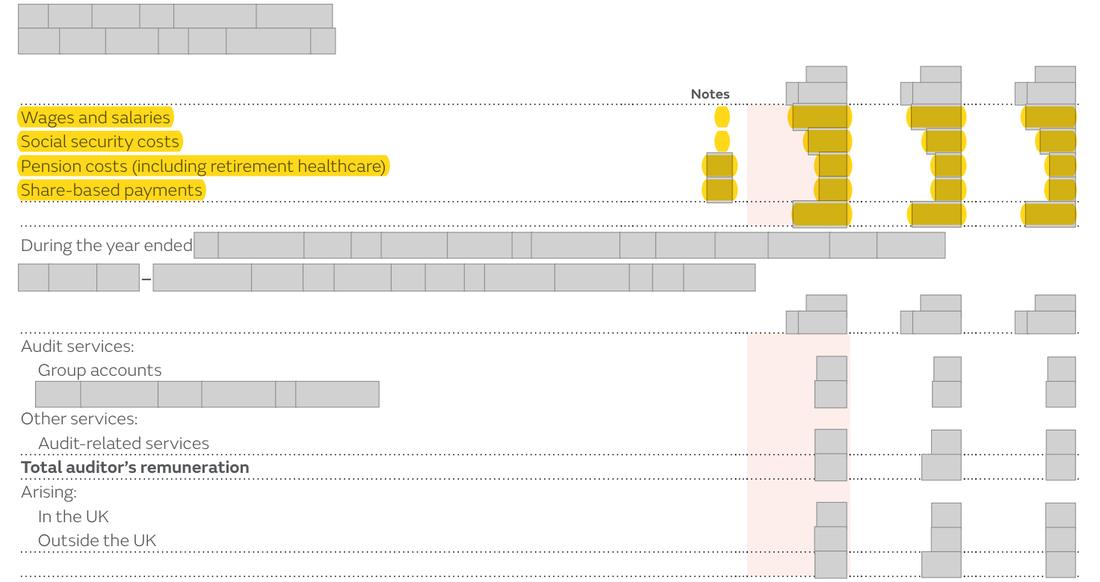
Further pages withheld to protect the company’s identity (two): Annual Report 2024, page 168; Annual Report 2025, page 190. Their wording or layout could lead back to the company even with names and figures masked; the evidence list below records what each page shows.
Names, figures, dates, logos and any wording that could be searched back to the company are boxed out in grey; the point is highlighted in yellow.
What the report shows, and what the rule requires
| What the annual report shows | What the rule requires |
|---|---|
| What the annual report shows Chart: Total Employee Costs [amount] (2023: [amount]) = wages and salaries only; third measure labelled Attributable Profit [amount] (2023: [amount]); text says 'trading profit'. | What the rule requires A label that matches the figure (wages and salaries, or total staff costs of [amount]) and text that names the comparator actually shown, with a short note on why it was chosen and how it is calculated. |
The rule
SI 2008/410 Schedule 8 paragraph 20(1)(a)
Version relied on: Large and Medium-sized Companies and Groups (Accounts and Reports) Regulations 2008 (SI 2008/410), in force from April 2008, as amended (the directors’ remuneration report Schedule 8 as substituted from October 2013); revised text, legislation.gov.uk
the actual expenditure of the company, and the difference in spend between those years, on— (a)remuneration paid to or receivable by all employees of the group
SI 2008/410 Schedule 8 paragraph 20(2)
Version relied on: Large and Medium-sized Companies and Groups (Accounts and Reports) Regulations 2008 (SI 2008/410), in force from April 2008, as amended (the directors’ remuneration report Schedule 8 as substituted from October 2013); revised text, legislation.gov.uk
There must be set out in a note to the report an explanation in respect of sub-paragraph (1)(c) why the particular matters were chosen by the directors and how the amounts were calculated.
Why it applies here: a reader cannot tell what 'Total Employee Costs' covers or which profit measure the Committee compares pay with; the regulations ask for remuneration of all employees and a note explaining any other measure chosen.
Why it matters
Readers comparing pay with shareholder returns and profit are told the comparator is trading profit and that the pay bar is total employee costs, when the bars show attributable profit and wages and salaries only.
Exposure
Presentation in the remuneration report; no regulatory consequence expected.
Our workings
the text reads '[wording masked]' and the chart shows 'Total Employee Costs' [n] (2024) and [n] (2023) and 'Attributable Profit' [n] and [n] (p.168, figures read from the chart image). Note 3.1 shows wages and salaries [n] and [n], social security [n], pension costs [n] and share-based payments [n], total [n] and [n]. The 2025 report repeats the wording and labels.
[n] + [n] + [n] + [n] = [n]; [n] - [n] = [n], so the label 'Total' leaves out [amount] of staff costs; [n] / [n] = 81%.
| Item | Computation | Result |
|---|---|---|
| Total staff costs 2024 (Note 3.1) | [n] + [n] + [n] + [n] | [n] |
| Staff costs outside the chart label | [n] - [n] | [n] |
| Chart figure as share of total staff costs | [n] / [n] | 81% |
Management’s best defence, and our reply
The company could say that wages and salaries are the usual measure of remuneration in this table and that attributable profit is a better comparator than trading profit, so the word 'trading' in the text is a harmless slip. It could add that both figures tie to the audited accounts. However, the chart calls the figure 'Total' employee costs when the audited total is [amount], and the text names a measure the chart does not show, in two successive reports; a reader cannot reconcile them without the notes.
The fix
- Relabel the bar 'Wages and salaries' (or show total staff costs of [amount]), change the text to 'attributable profit', and add one line on why attributable profit is shown and that it is the income statement figure.
Evidence relied on
| # | What it shows | Type | Where |
|---|---|---|---|
| 1 | The text names trading profit as the comparator | Document | Annual Report 2024, page 168 |
| 2 | Chart 'Total Employee Costs': 2024 [amount], 2023 [amount] (read from the image) | Document | Annual Report 2024, page 168 |
| 3 | Third bar is attributable profit: 2024 [amount], 2023 [amount] | Document | Annual Report 2024, page 168 |
| 4 | Wages and salaries equal the chart's 'Total Employee Costs' | Document | Annual Report 2024, page 205 |
| 5 | Social security costs 2024 [amount] | Document | Annual Report 2024, page 205 |
| 6 | Pension costs 2024 [amount] | Document | Annual Report 2024, page 205 |
| 7 | Share-based payments 2024 [amount] | Document | Annual Report 2024, page 205 |
| 8 | Total staff costs 2024 [amount] | Document | Annual Report 2024, page 205 |
| 9 | The 2025 report repeats the trading profit wording | Document | Annual Report 2025, page 190 |
| 10 | The 2025 report keeps the 'Total employee costs' label for wages and salaries ([amount]) | Document | Annual Report 2025, page 190 |
Prepared by Pramanex from the company’s published annual reports, without the company’s involvement, to show how an annual report review reads. The company is not named, and nothing on this page is a statement about any identifiable company. Observations are not an audit, review or other assurance engagement, and not legal advice. A regulator-style question is a question, not a conclusion.
Want this on your own annual report, before it is published?
Start with three free findings on your latest published annual report, or talk to us about a fixed-fee pre-publication review.
Your annual report will be in draft before the year-end audit.
Have it read before it is published.
Under NDA, with our reviewer on your insider list under UK MAR.